Overview
As a news and media company, it is of utmost importance for McClatchy to understand it's readers. Therefore, in late 2019, McClatchy worked with a consulting company to better understand their user base (subscribers and non-subscribers) and their news consumption habits. The consulting company came up with six typologies that encompassed user habits. I used those typologies and McClatchy's existing user funnel stages to create a series of visualizations that would help everyone understand all of McClatchy's users on all sites. After working very closely with the analytics team I was able to combine these two types of data for the first time and create some intriguing visualizations.
These visualizations fundamentally changed the way McClatchy was looking at user segmentations. Using these for strategic decisions and prioritization became part of the workflow within the entire product department.
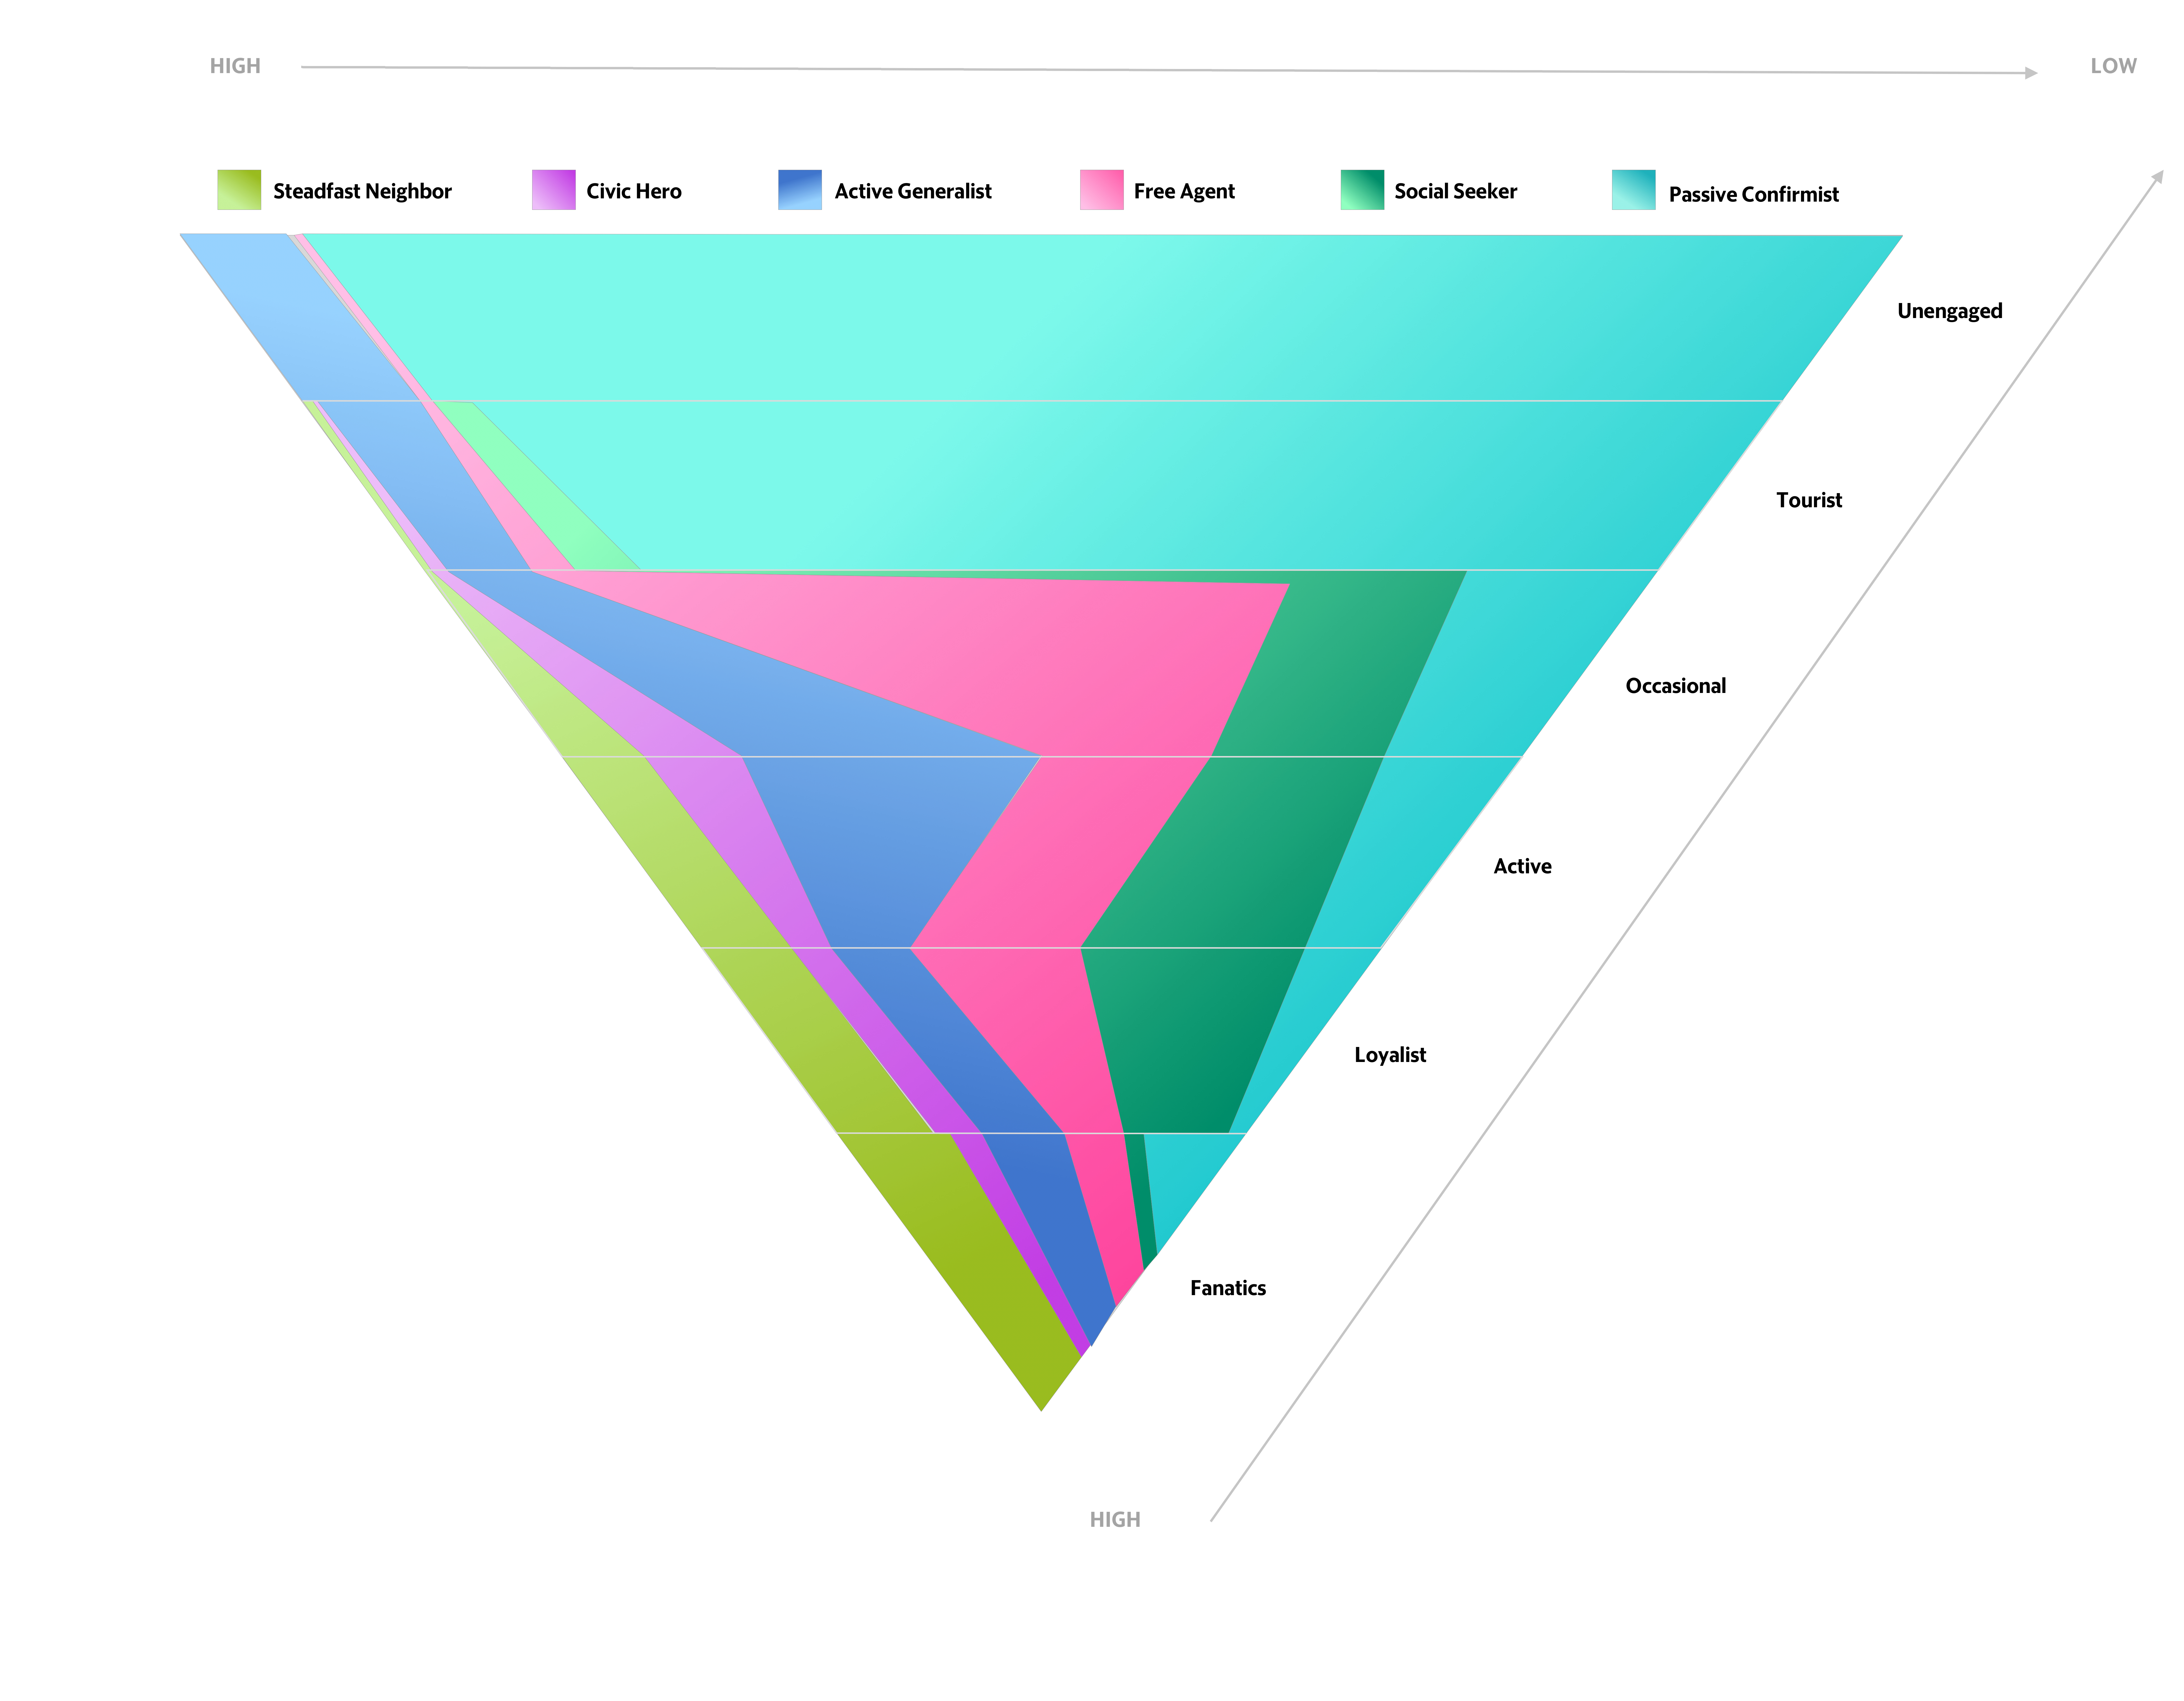
Typologies + Funnel Stages
This visualization shows an approximation of the total number of visitors that share the typology traits in each of the funnel stages. It very clearly shows most of the people who visit McClatchy's sites are Passive Conformists. We also determined that 'Active' Steadfast Neighbors have the most potential to become subscribers.
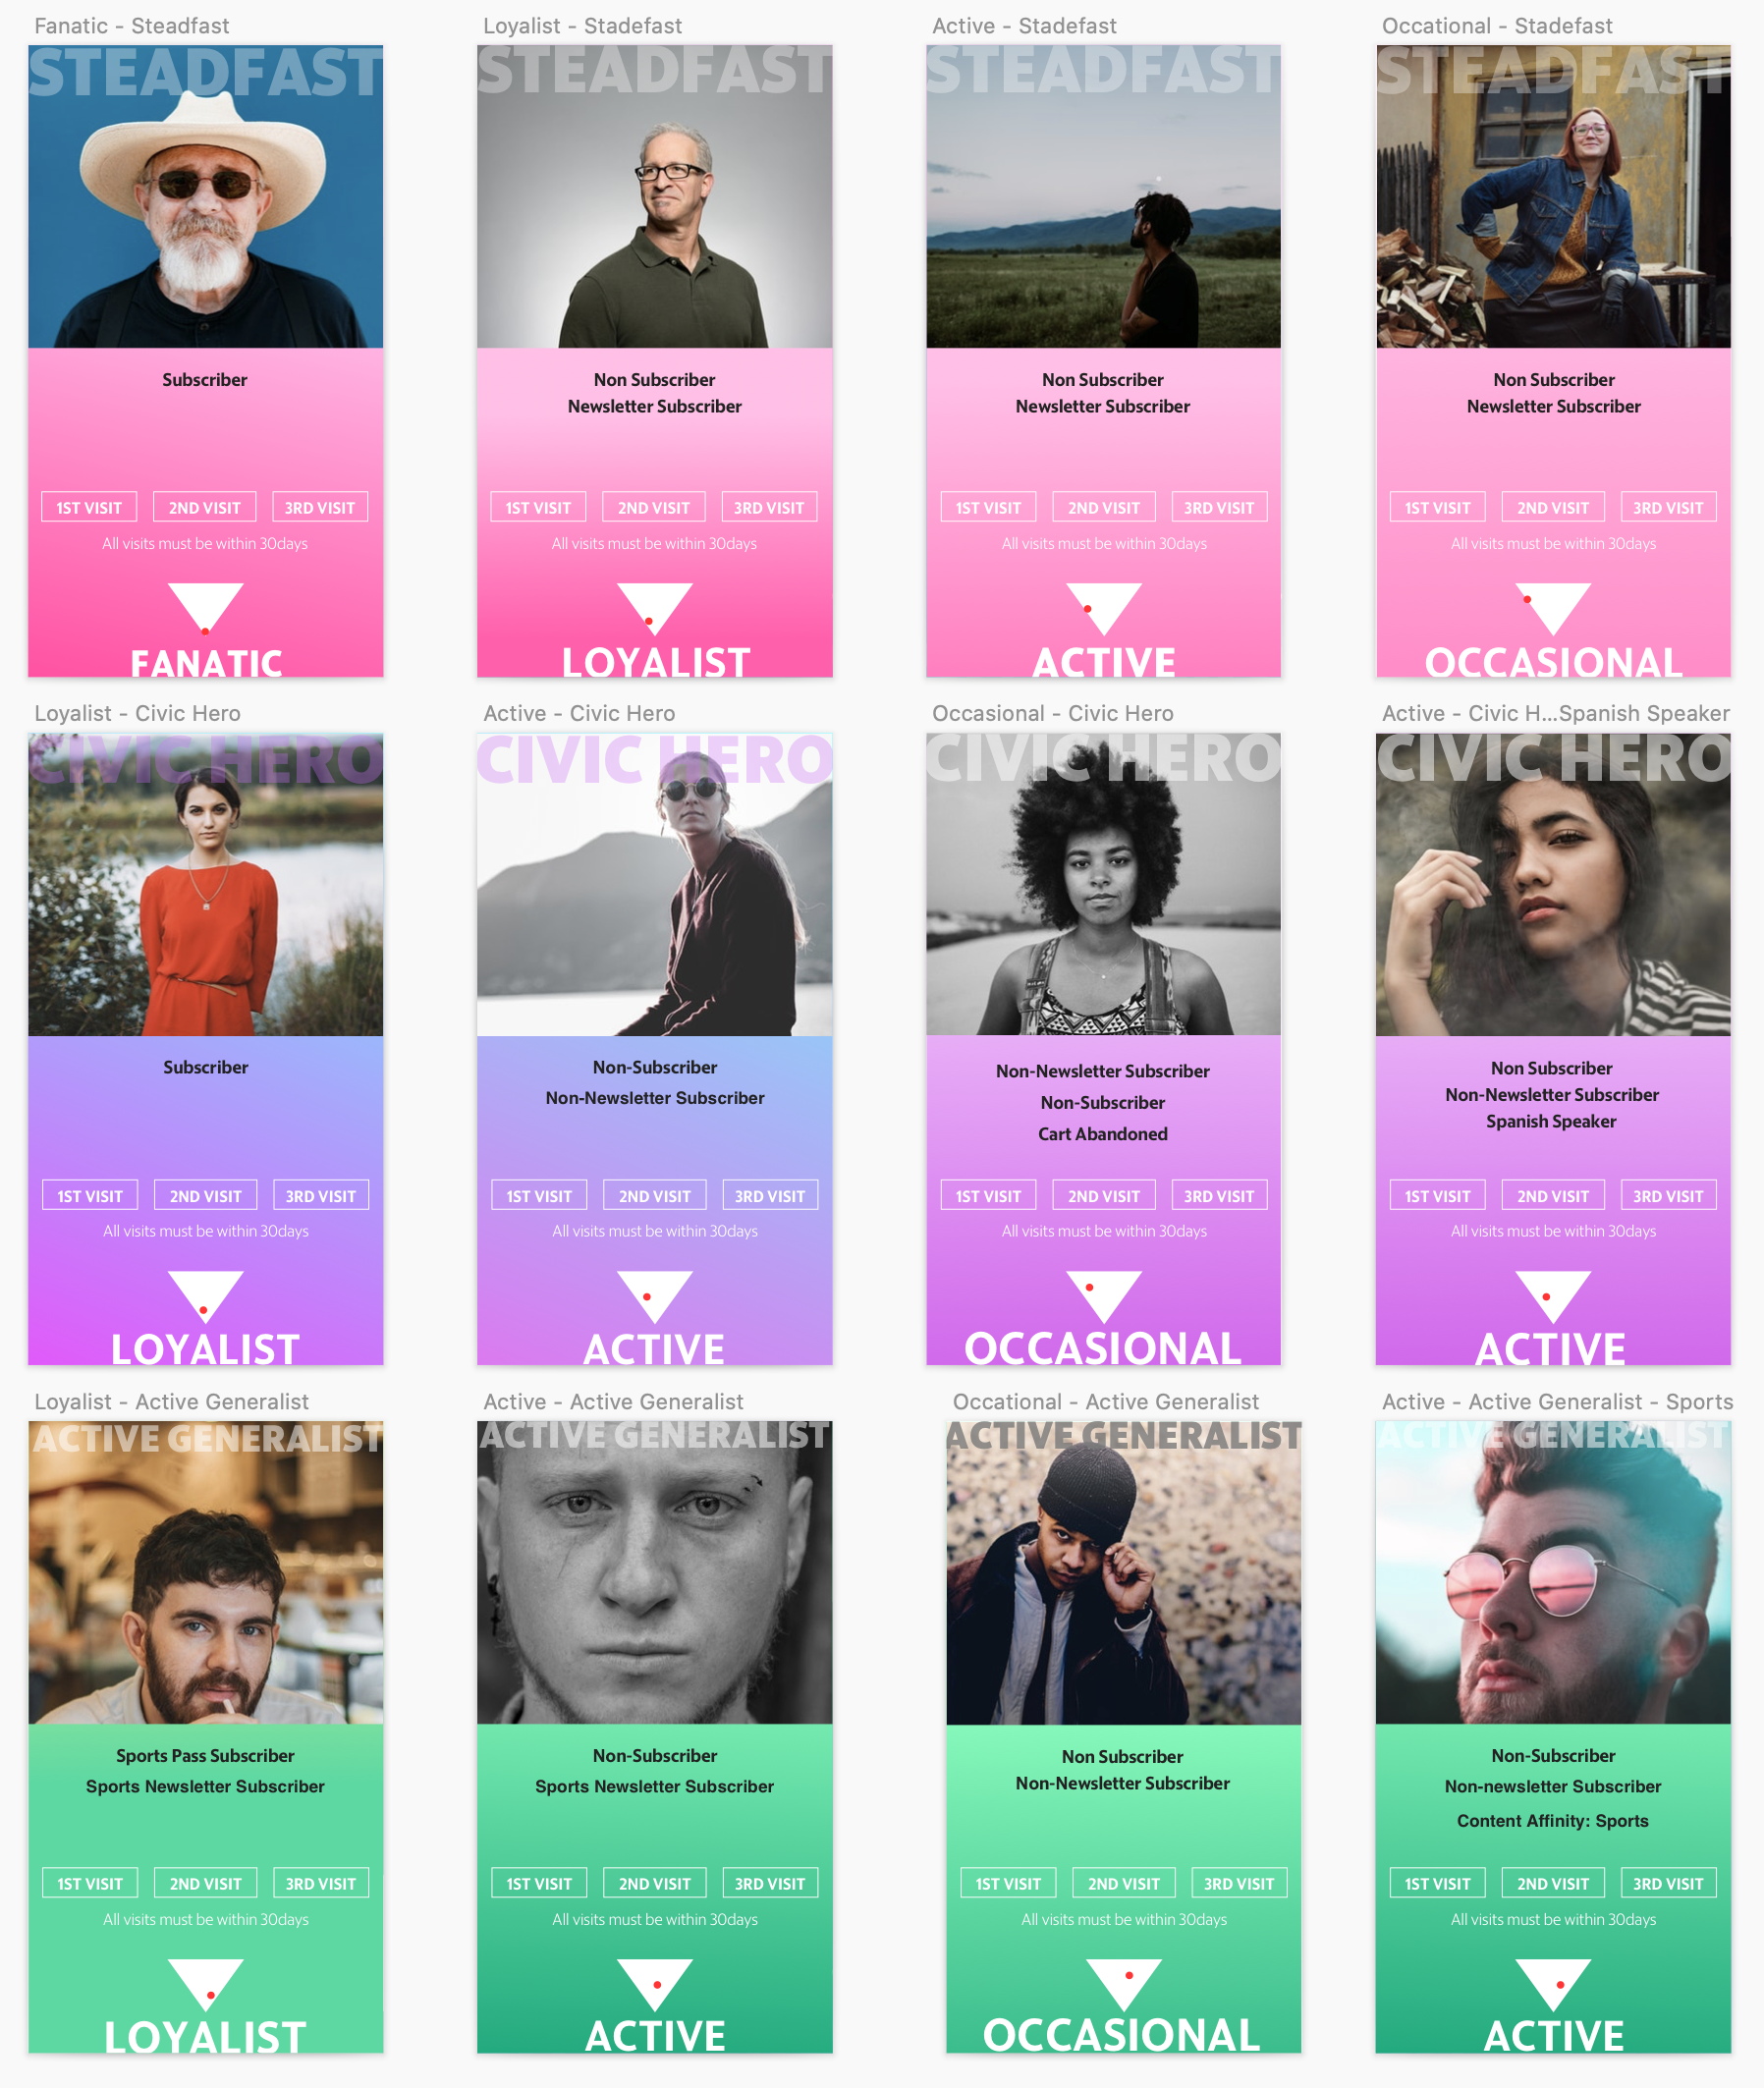
Personas
I created personas for each of the segments that I later used for all the future user journeys. It helped ask and answer the question: "Who is this for?". I combined the existing qualitative data with the quantitative data to create these personas. For example, via surveys and various user interviews, we know that most of our subscribers are older demographic. I also intentionally made these personas less racially diverse based on the data I had. I always made sure to point that out during stakeholder meetings in the hope to raise awareness and to help think of strategies to reach a more diverse audience.
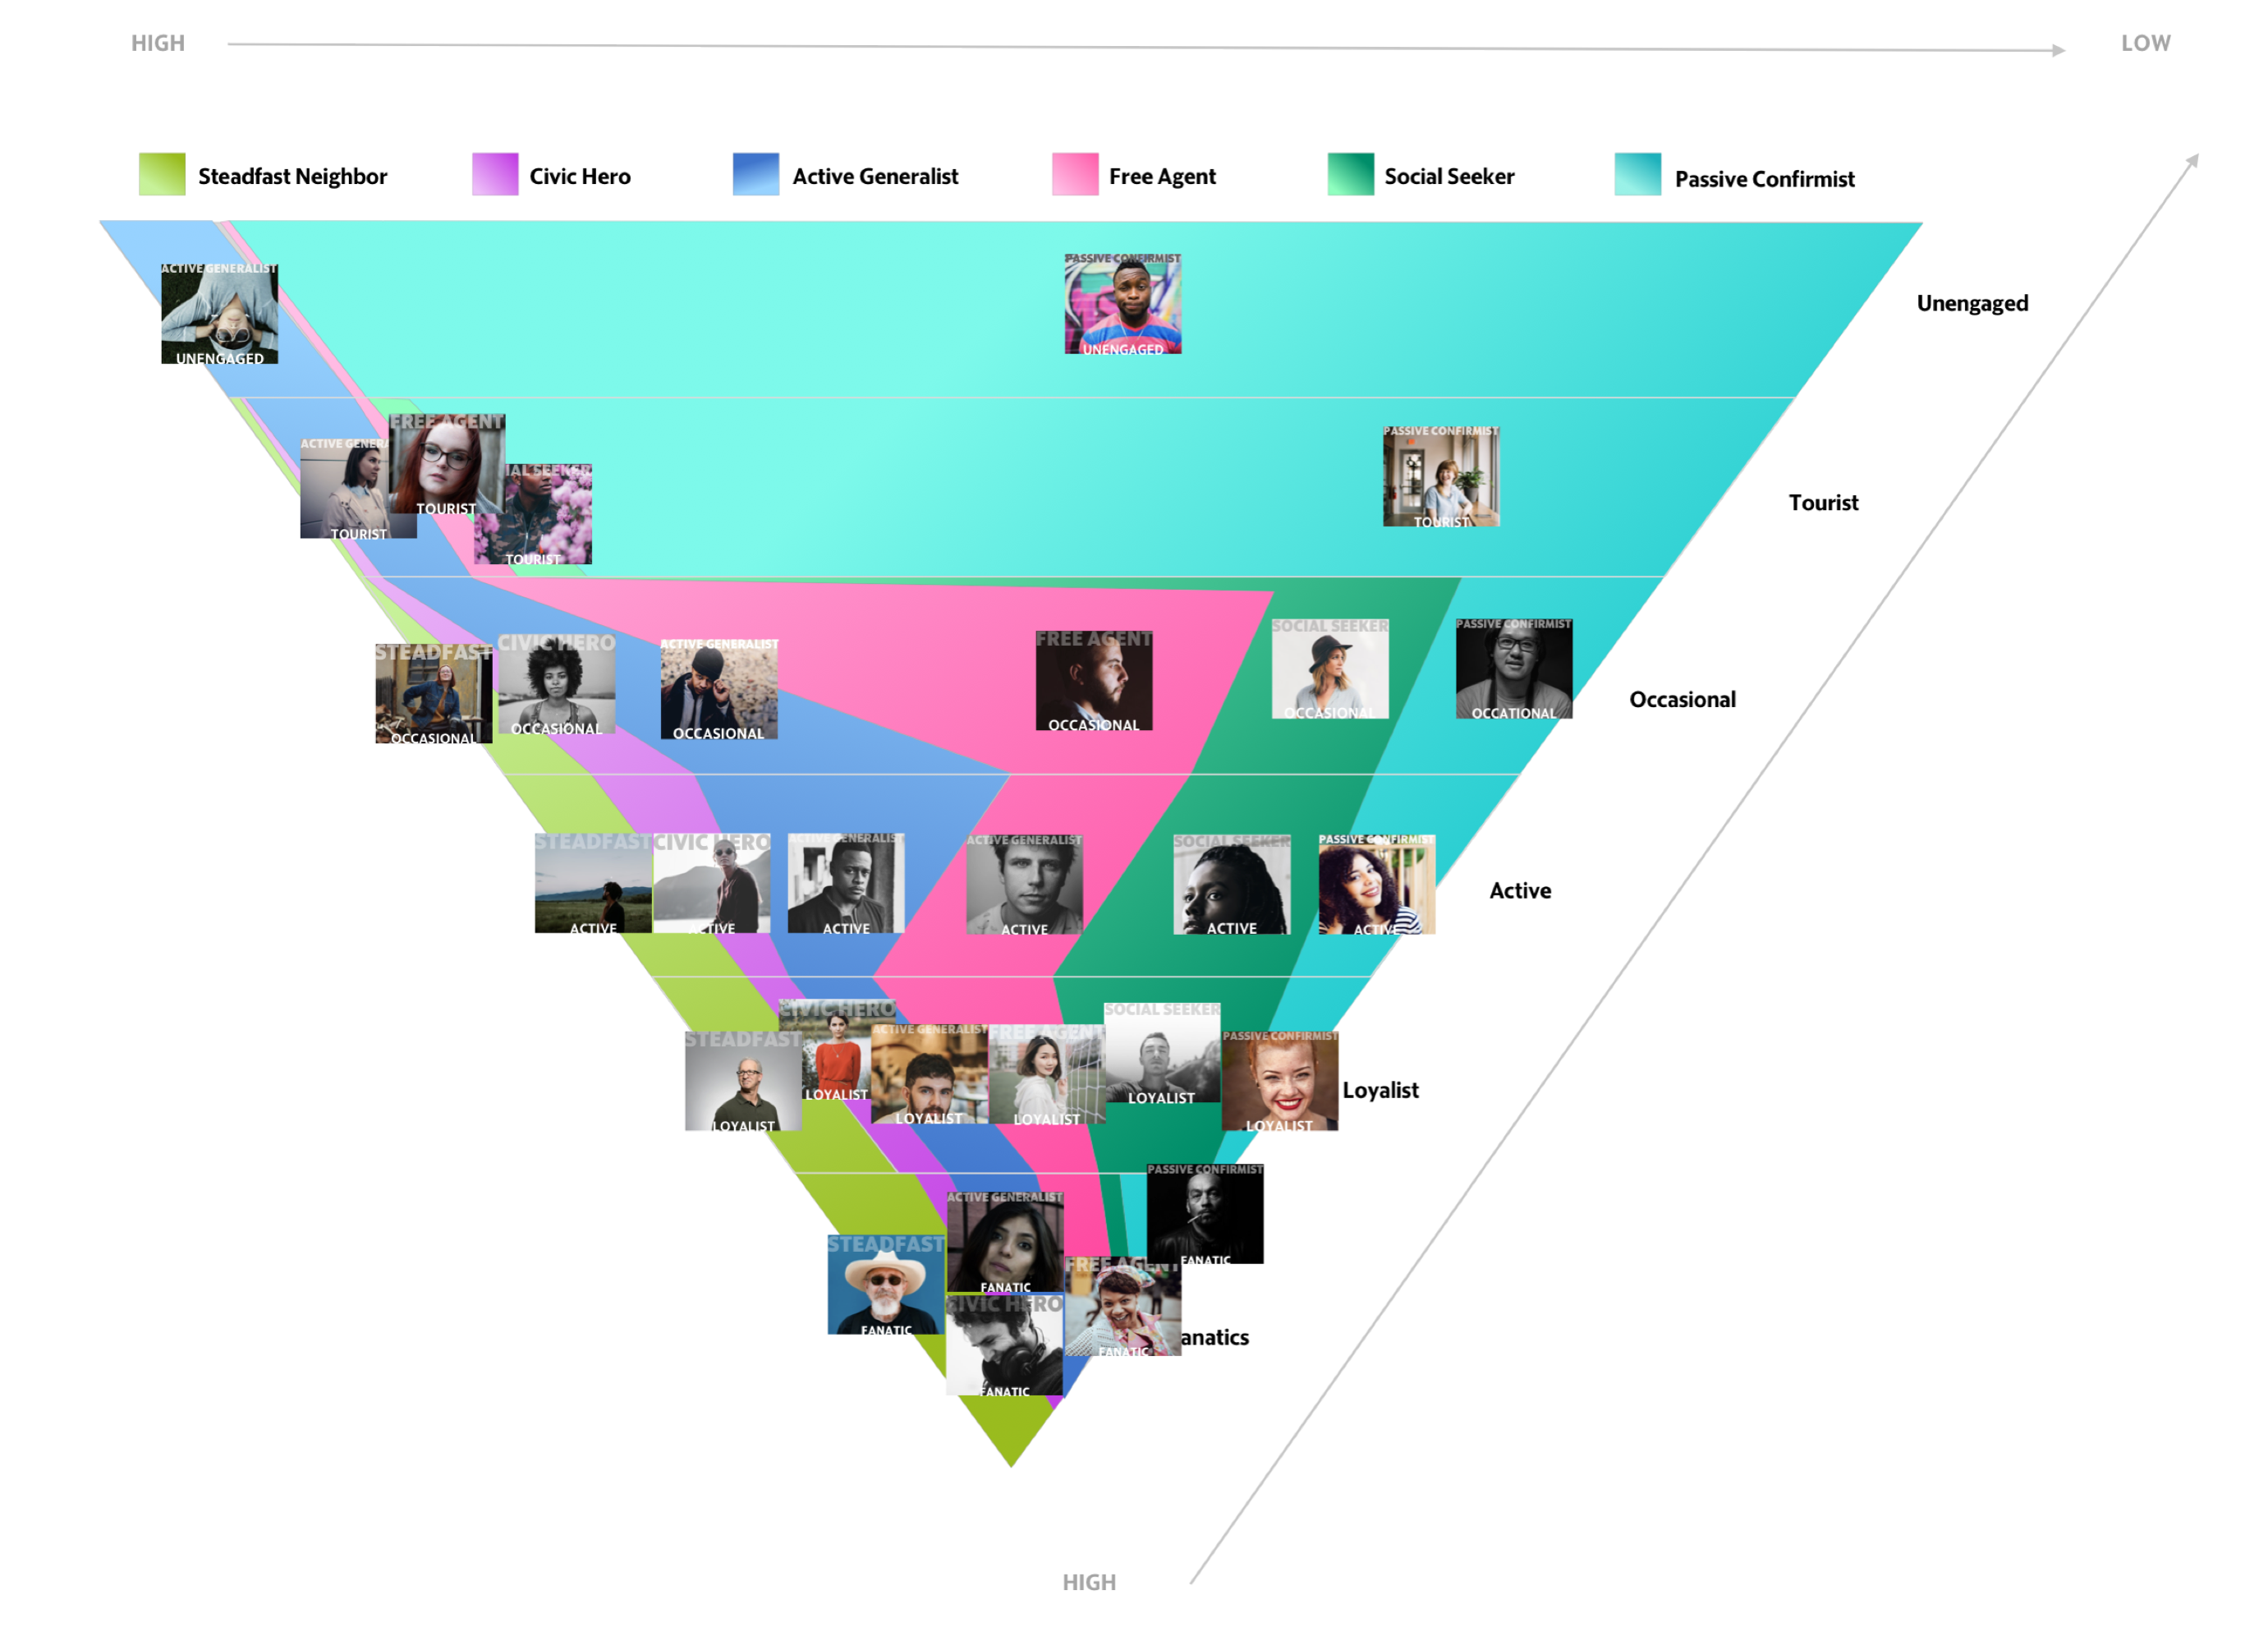
User Segmentations
I used those personas to plot them in the segments. This drove the point that there are real people behind all the segmentations and numbers. It helped establish that each segment is unique like each of these people and it's important to craft our experiences accordingly. The marketing language we use for each typology needs to be curated just for them and all of our engagement strategies need to be appropriate for that funnel stage. For example, it is unlikely that a user who visits one of McClatchy's sites once every few months is ready to purchase a subscription. Therefore, instead of showing a subscription module, it might be more beneficial to try to get them to sign up for a newsletter. That gives the user a way for them to come back to the site more often. The right experience at the right time for the right user.v
I used those personas to plot them in the segments. This drove the point that there are real people behind all the segmentations and numbers. It helped establish that each segment is unique like each of these people and it's important to craft our experiences accordingly. The marketing language we use for each typology needs to be curated just for them and all of our engagement strategies need to be appropriate for that funnel stage. For example, it is unlikely that a user who visits one of McClatchy's sites once every few months is ready to purchase a subscription. Therefore, instead of showing a subscription module, it might be more beneficial to try to get them to sign up for a newsletter. That gives the user a way for them to come back to the site more often. The right experience at the right time for the right user.
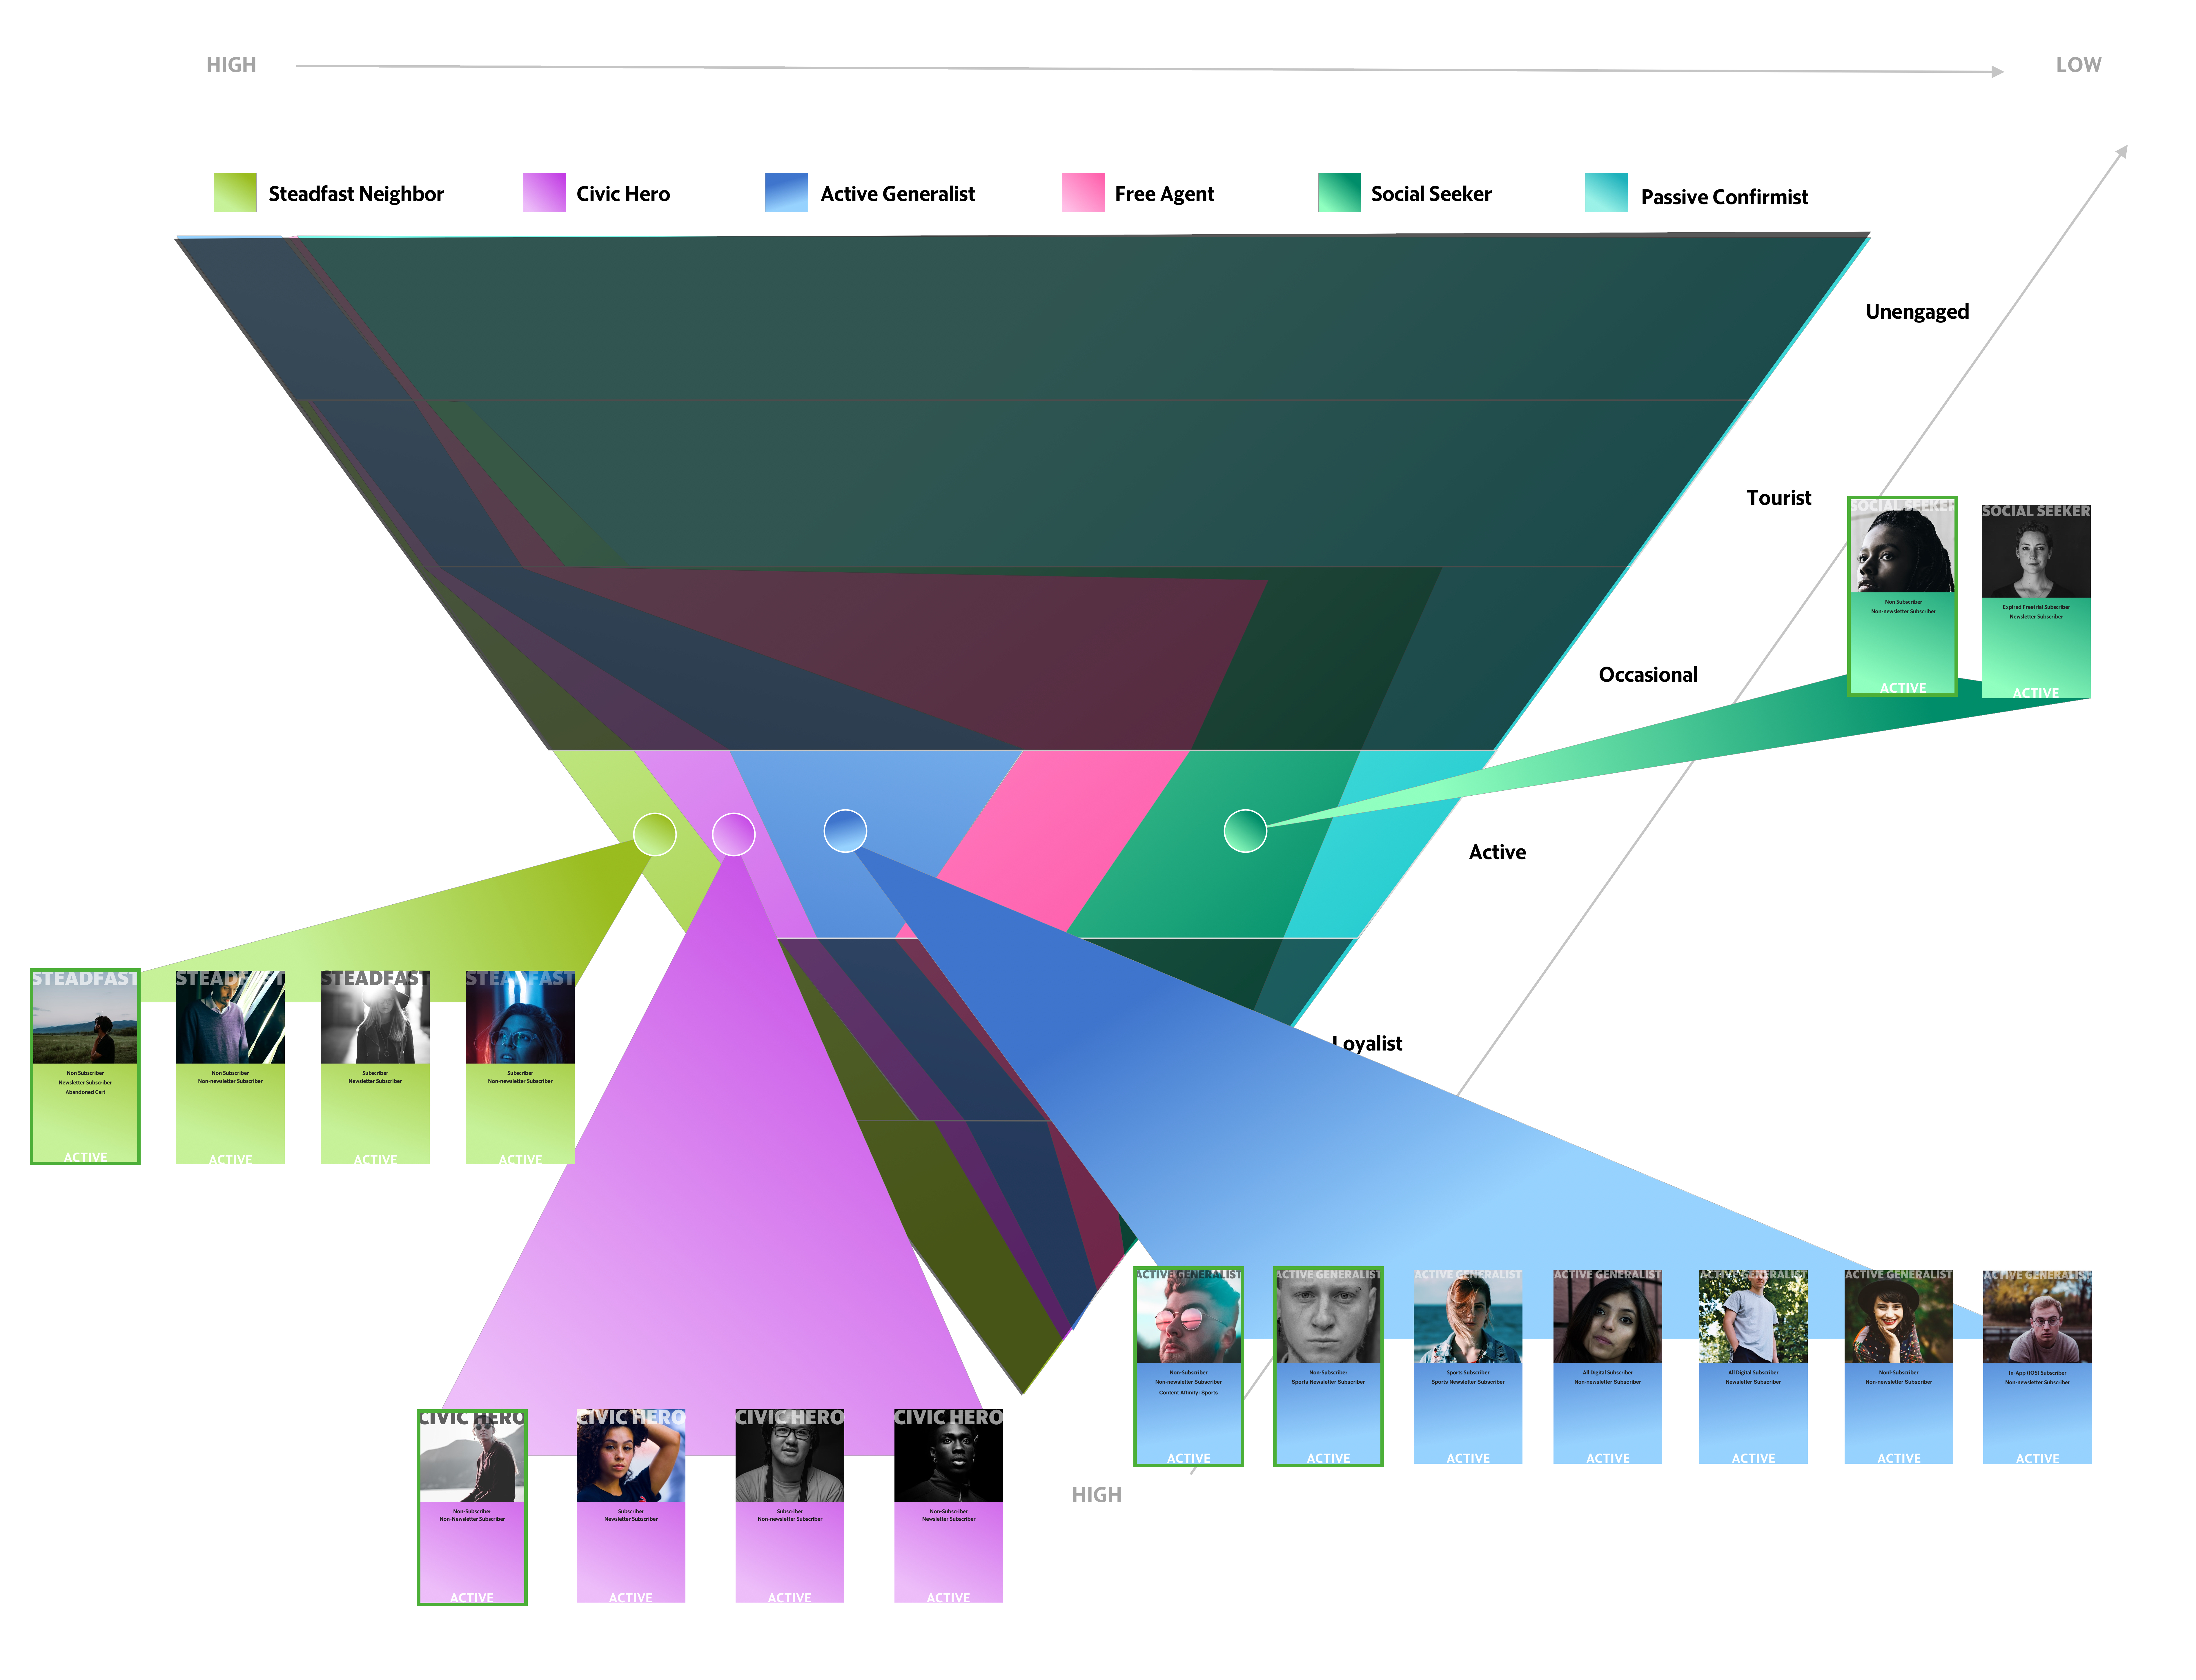
Dynamic Zones
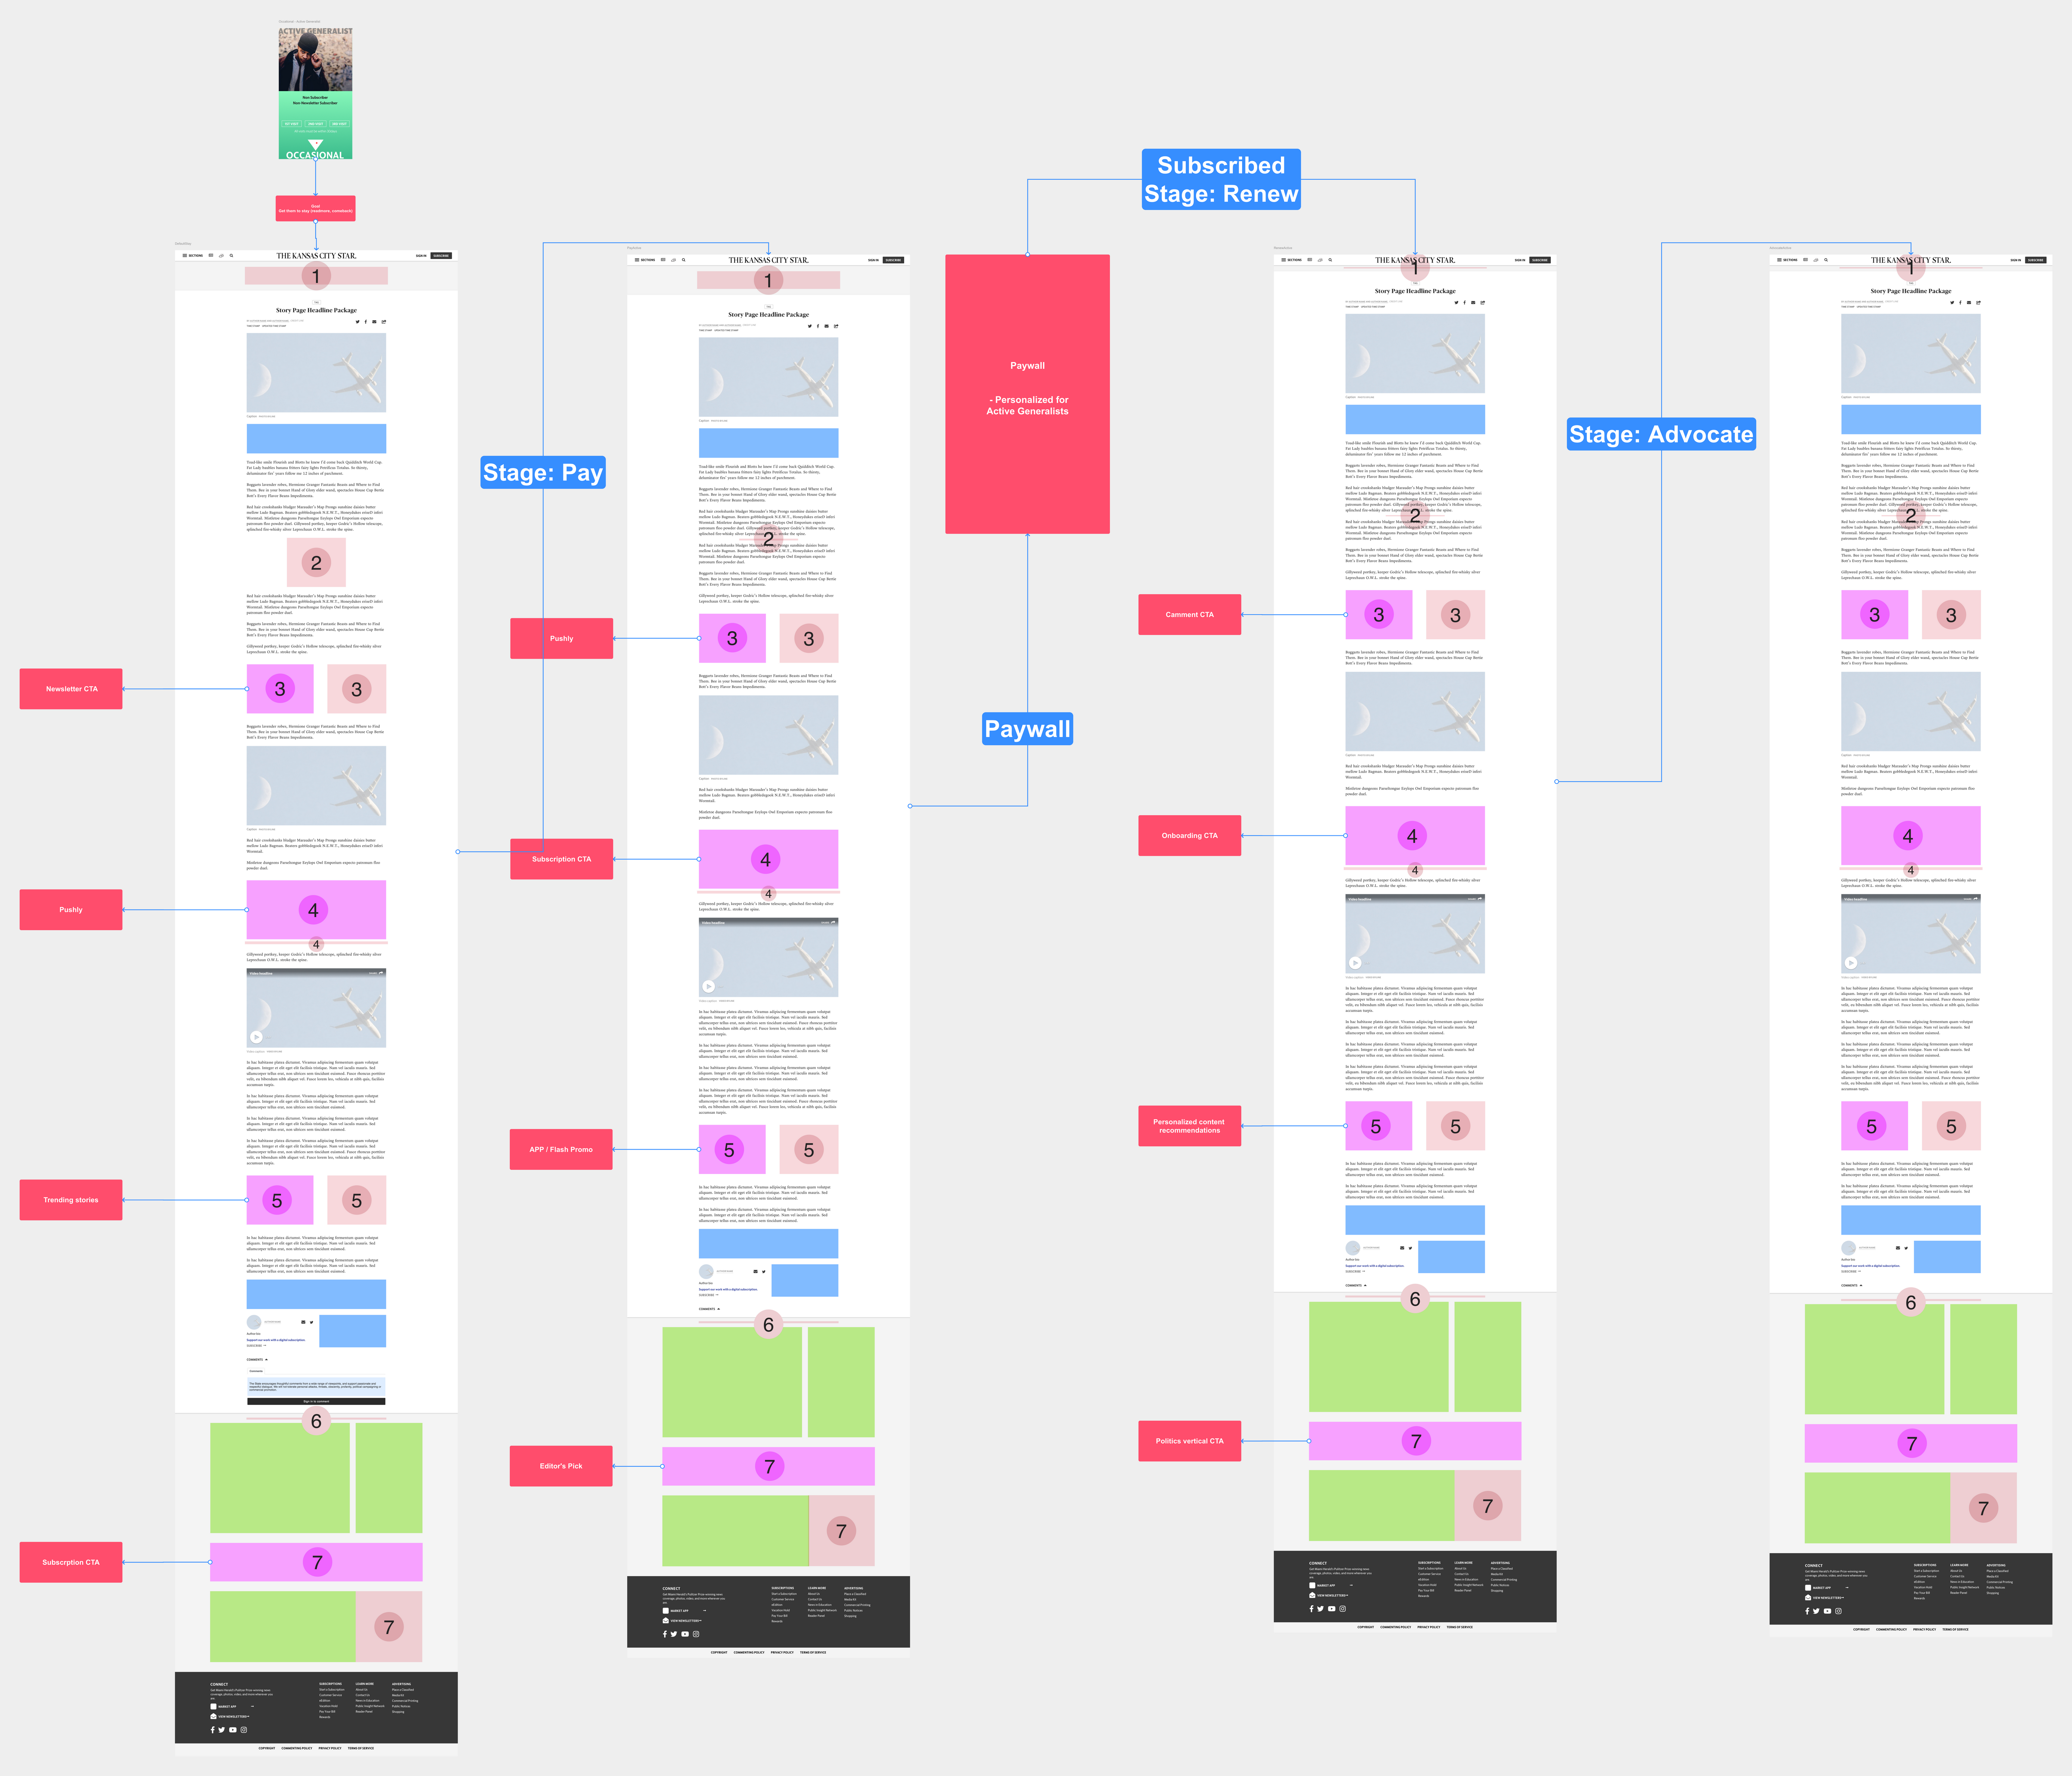
These segmentations enabled our team to create personalized user journeys and we matched these journeys with specific business goals. These journeys were designed to help move the users down the funnel. This is an example of how the different zones (modules) on the story pages will dynamically change based on where a user is in the funnel stage.
